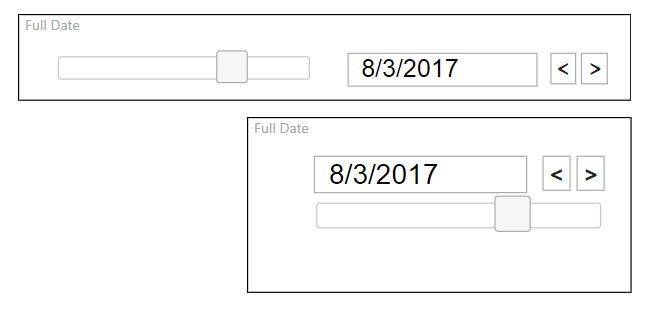
In, comes the custom visual. I blended a jQuery UI Slider with a text input box, and two spans styled as buttons. The user can use the increment and decrement buttons to move to the next item, click the bar or drag the thumb to zoom to a location, or enter the exact value they are looking for. There's some validation built in. For instance, manually entered values are checked against the list of possibles. The user can't make the control increment or decrement pas the end of the sets...
Next post, getting into the dirty work of implementing the visual. The whole thing is a TypeScript project following the Node.js patterns. NPM works great to add some of the common features, but the uncommon ones? I may have not followed the specs perfectly when including custom JavaScript (jQuery UI + code to implement the combined UI elements), but it's working at the moment. I'll be digging into how exactly to bring these custom features into a project correctly, as it appears that "non project" code should be include through NPM...
No comments:
Post a Comment